Download Your Free
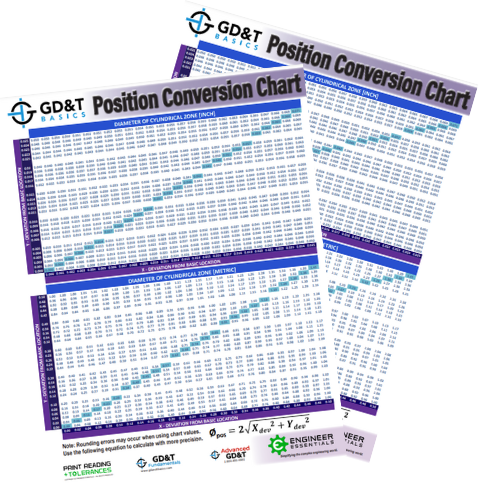
Position Conversion Chart
Those who are new to GD&T are typically used to dealing with an X, Y coordinate system for locations of features. This chart shows you how to convert X, Y coordinate measurements into a reportable position tolerance (based on a diameter). If you are measuring a position tolerance with calipers, or other simple equipment, this chart will quickly tell you the reportable position tolerance for your feature.
The GD&T Position symbol allows 57% more tolerance than coordinate dimensioning.
Geometric Dimensioning and Tolerancing allows functional requirements of a design to be met without adding unnecessary tight restrictions, as seen with coordinate dimensioning. Watch this lesson from our GD&T Fundamentals course to learn more about how this is achieved using the GD&T Position symbol.
Our Position Conversion chart, referenced in this video, can be downloaded for free, above.
You will also receive...
In addition to the Position Conversion chart, watch for emails with download links to these helpful resources.
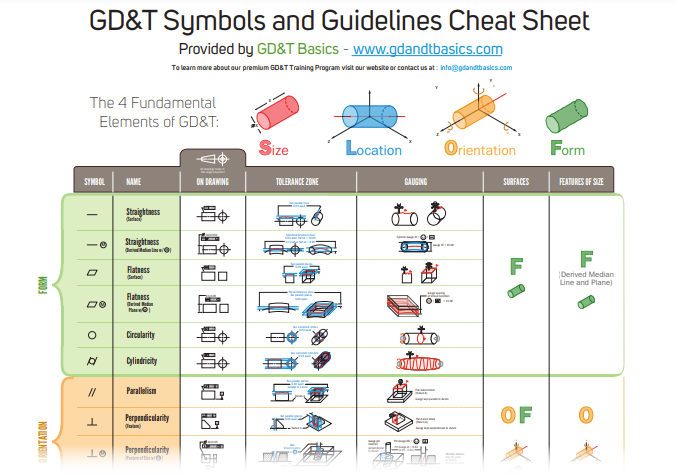
GD&T Symbols Reference Chart
The GD&T Symbols Reference Chart is our “cheat sheet” for everything about GD&T. We designed this comprehensive chart with you in mind so that:
- You can review all 14 symbols: see how they appear on engineering drawings
- You can understand what the meaning of the symbol actually is and what it controls
- Bring it all together with information on how each control is measured
Drill Tap Chart
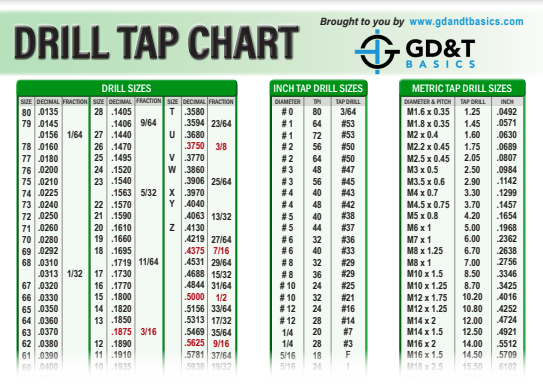
The most common way to produce an internal thread is to drill a hole and then use a tap to produce the thread. This is usually referred to as a tapping drill for the size of thread that needs to be produced.
This drill tap chart provides the information you need to properly drill and tap holes. This chart includes values for screw sizes and the proper size drill bit to use to make the hole for the tap.
There are four unique tables on this Tap Drill Chart:
- DRILL SIZES – This table lists all drill sizes up to 1.000” and the most common from 1.000” up to 1.500”
- INCH TAP DRILL SIZES – This table lists the most common tap sizes, typically one coarse and one fine thread each, from a #0 to 1-1/2
- METRIC TAP DRILL SIZES – This table lists the most common tap sizes, typically one coarse and one fine thread each, from M1.6 to M39
- PIPE THREADS (NPT) – This table lists the common NPT threads from 1/16” to 3”
Orthographic Projection Chart
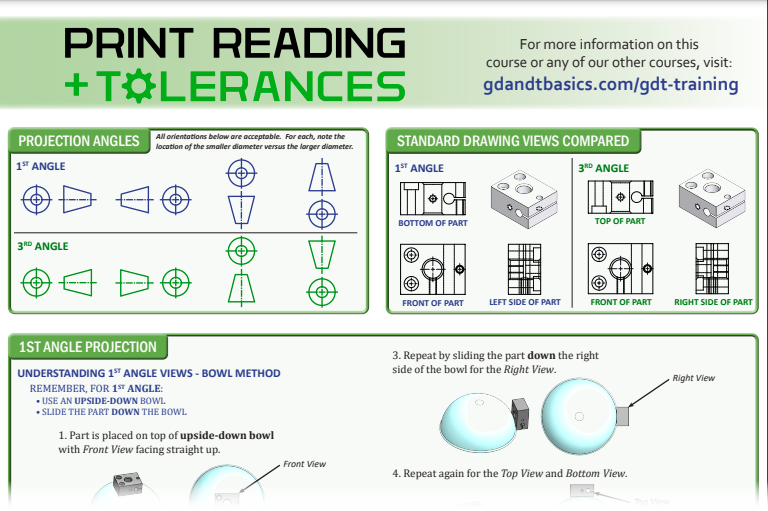
There’s a lot of confusion in our industry when it comes to Orthographic Views. Our intent is to provide a reference that is simple to use and easy to understand. There are two projection methods used and a symbol (sometimes referred to as the “plug symbol”) on the drawing - used to identify which one of the two methods is used. Only one is allowed to be used on any given drawing. We must always identify which method is used when we are required to interpret a drawing. Not doing so can result in incorrect manufacture, inspection and ultimately, scrapped parts.
The two projection methods are:
- First Angle Projection places the object between the observer and the plane of projection. Sometimes referred to as the “European Projection”, this is the projection method used by ISO and those adhering to the ISO standards will most often use this.
- Third Angle Projection places the plane of projection between the observer and the object. Sometime referred to as the “American Projection”, this is the projection method that ASME uses as it is the one used most often in the United States and Canada.
ASME vs. ISO GD&T Standards Comparison Chart
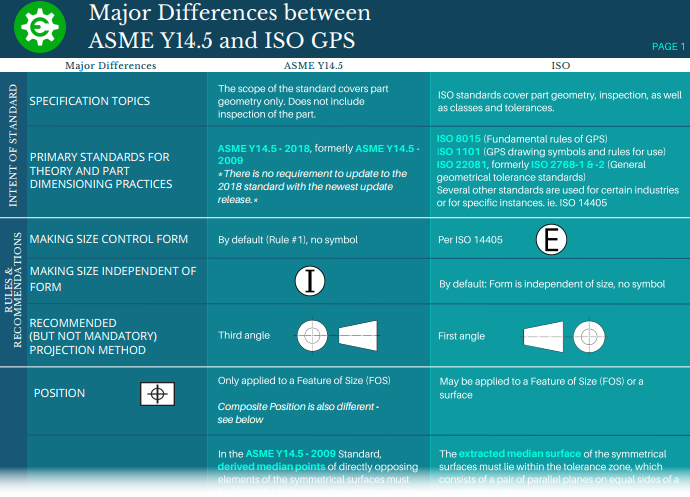
The most popular standards that define requirements for GD&T are published by the American Society of Mechanical Engineers (ASME Y14.5) and the International Organization for Standardization (ISO GPS standards). We have summarized the major differences between these two standards and have compiled them into this handy comparison chart.
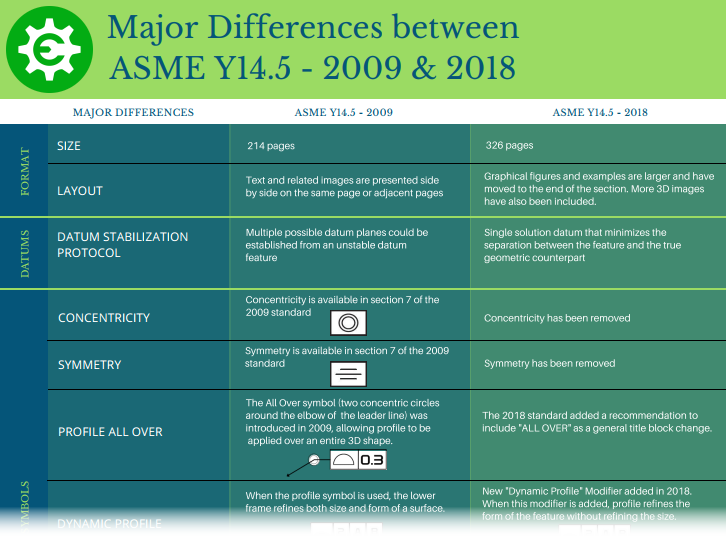
ASME Y14.5 2009 vs 2018 Comparison Chart
ASME Y14.5 is one of the world’s most widely accepted standards for geometric dimensioning and tolerancing. Several changes were made in the 2018 version of this standard. We have summarized the major differences between the 2009 and 2018 versions and included them in this helpful chart!
